Li-ion Battery and Gauge Introduction
1. Li-ion
Battery Introduction
1.1 SOC (State-Of-Charge)
SOC is defined as the status of available energy in the battery and usually expressed as percentages. Because the available energy change depends on different charging/discharging currents, temperatures and aging effects, the SOC could be defined more clearly as ASOC (Absolute State-Of-Charge) and RSOC (Relative State-Of-Charge). Typically, the range of RSOC is from 0% to 100%, a fully charged battery’s RSOC is always 100% and a fully discharged battery has 0% RSOC. The ASOC is a reference calculated by Design Capacity which is a fixed capacity from when the battery is manufactured. A fully charged new battery will have 100% ASOC, but a fully charged aging battery could be less than 100% because of different charge/discharge conditions.
The following diagram is an example of Voltage vs. Capacity at different C-Rates. The higher C-rate loading will have lower output capacity. Lower temperatures result in lower output capacity.
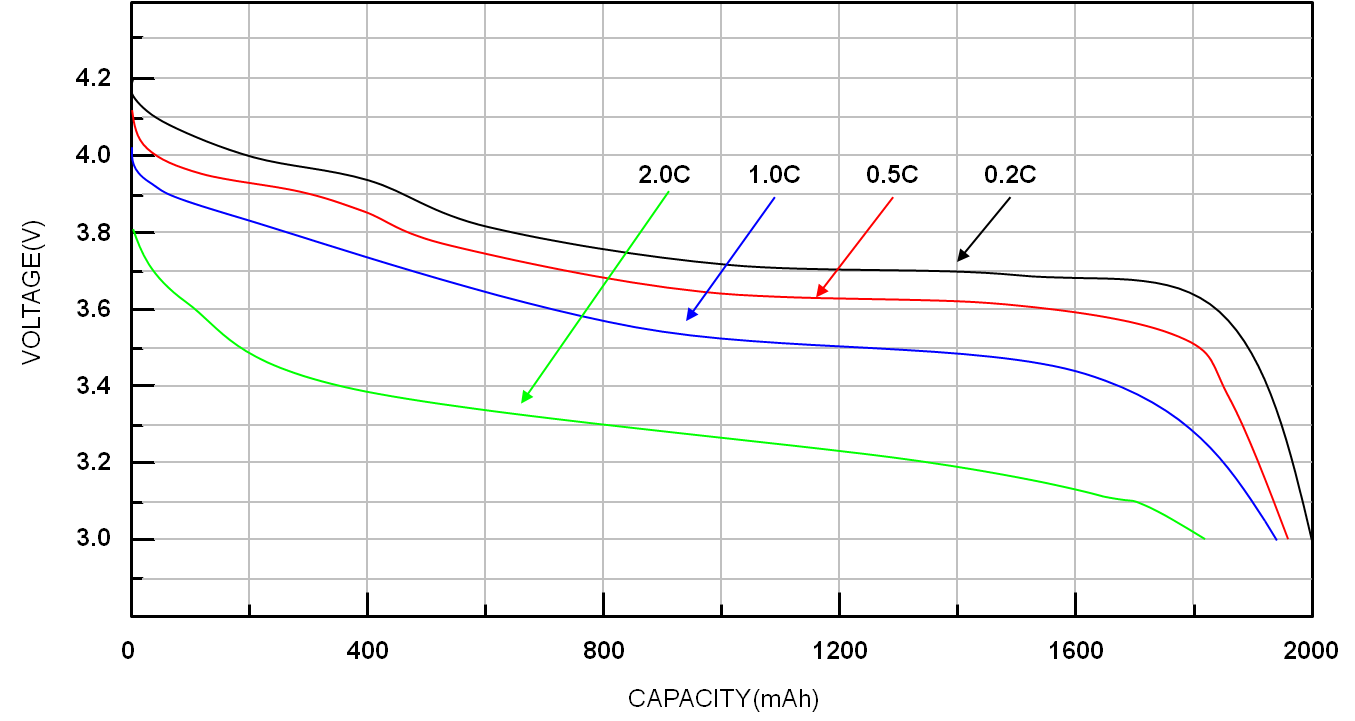
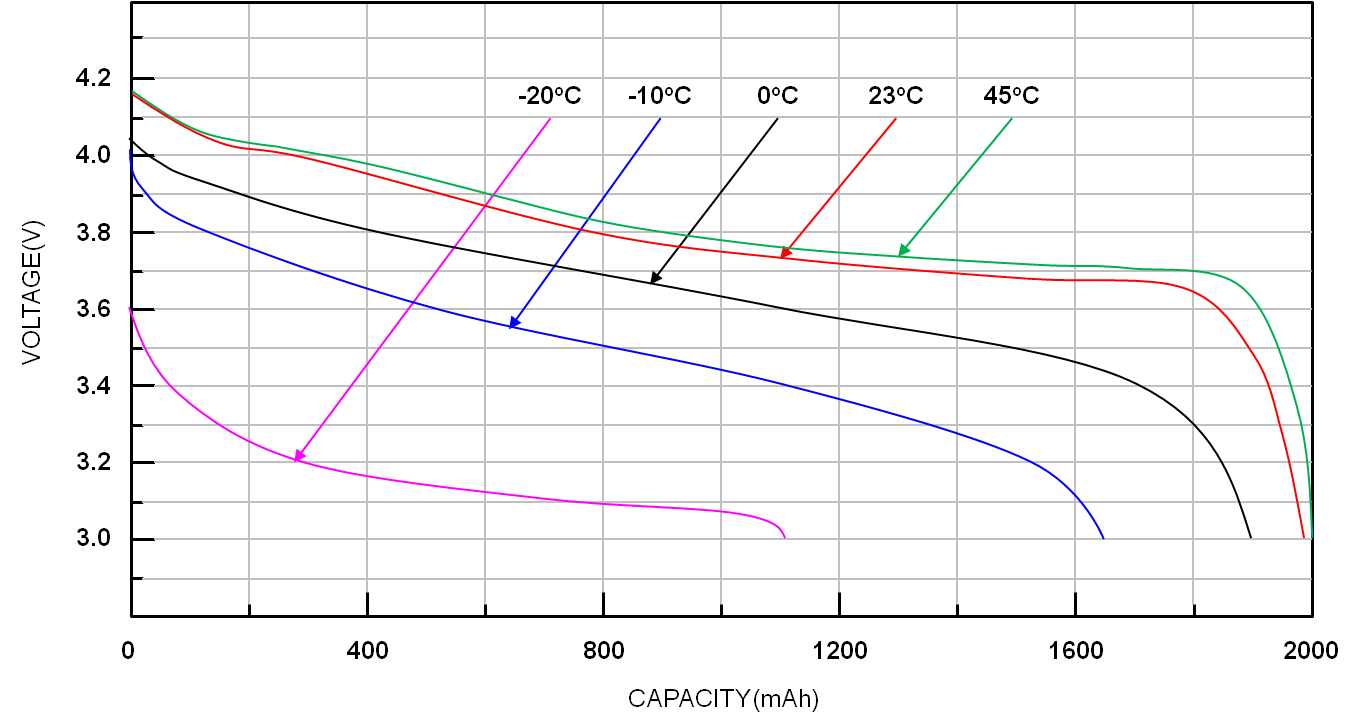
Figure 1. Voltage vs. Capacity at different C-Rates and temperatures
1.2 Max Charging Voltage
The Max Charging Voltage is decided by the chemistry component and characteristic of the battery. Typically, the Charging Voltages of a lithium-ion battery are 4.2V and 4.35V. It could be different if the anode/cathode material changes
1.3 Fully Charged
The battery is considered fully charged when the difference between battery voltage and charging voltage is within 100mV and charging current is less than C/10. The condition may change according to different battery characteristics
The diagram below shows the charging curve of a typical lithium battery. When the battery voltage is equal to Max Charge Voltage and charging current is less than C/10, the battery is considered fully charged.
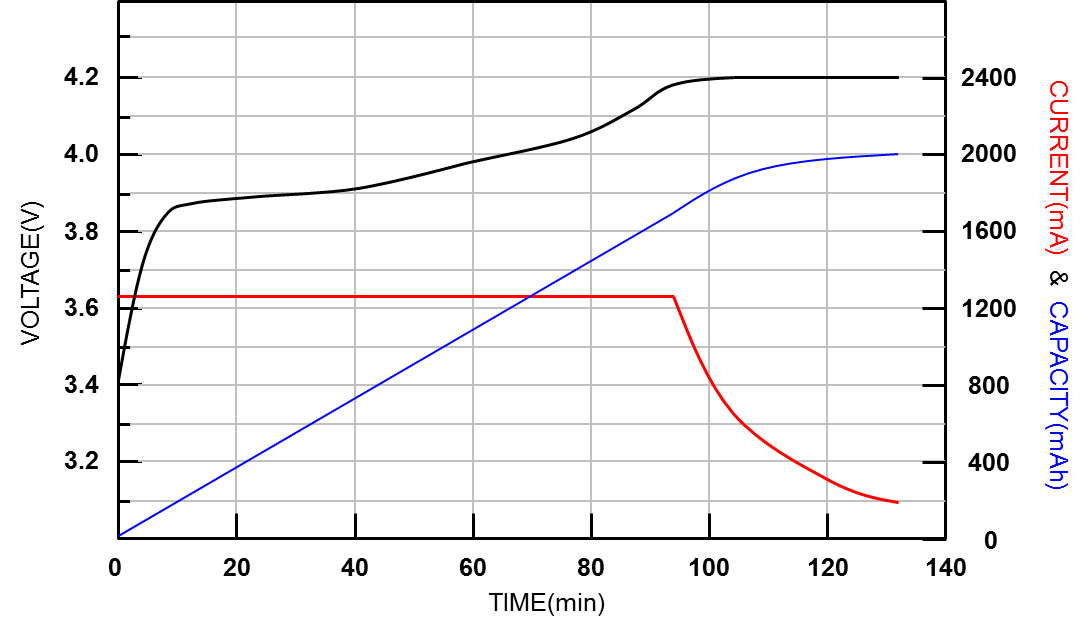
Figure 2. The charging curve of a typical lithium battery
1.4 Mini Discharging Voltage
The Mini Discharging Voltage could also be defined as terminal voltage. Usually, the Mini Discharging Voltage represents the voltage of SOC equal to 0%. The voltage is not fixed and will be charged according to different loads, temperatures, aging effects or user requirements.
1.5 Fully Discharge
A battery is considered fully discharged when battery voltage is equal to or less than Mini Discharging Voltage.
1.6 C-Rate
The C-Rate is the expression of Charging / Discharging Current which is normalized with battery capacity. For example, when discharging with 1C, the battery will be fully discharged in 1 hour ideally. The available capacity changes per different C-rates. Normally, the bigger the C-rate, the smaller the available capacity.
1.7 Cycle Count
The Cycle Count is a reference number of how many charging/discharging cycles a battery has experienced as aging. It’s estimated by the discharge capacity and design capacity. When the accumulated discharge capacity is equal to design capacity, the Cycle Count increases. Usually, the full charged capacity reduce 10%~20% after 500 cycles.
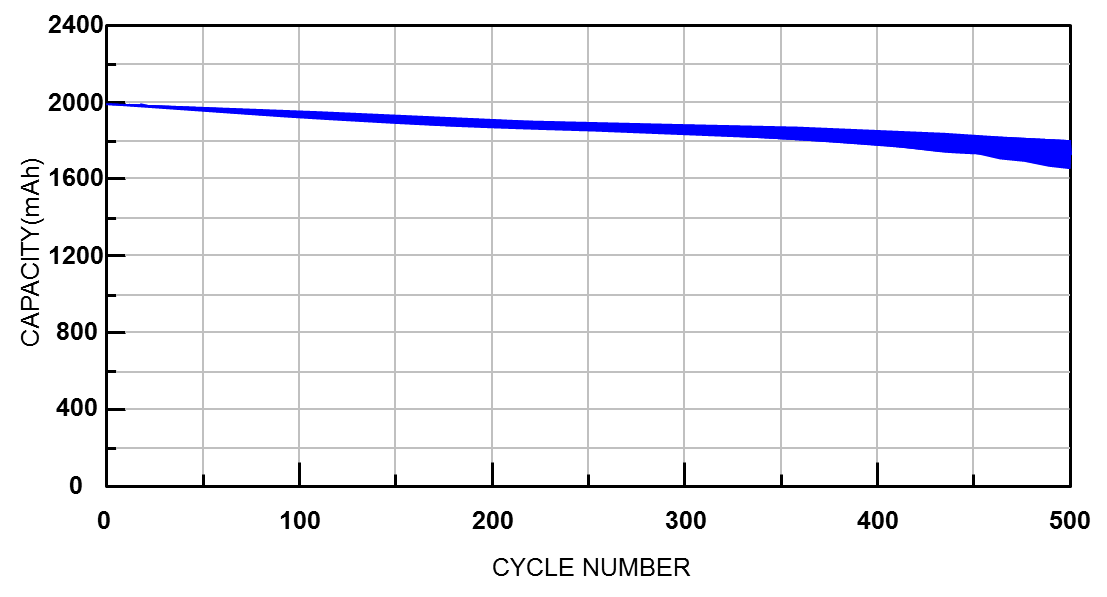
Figure 3. The full charge capacity at cycles
1.8 Self-Discharge
The self-discharge of all battery chemistries increases at higher temperature. Self-discharge is basically not a manufacturing defect but a battery characteristic. However, poor manufacturing practices and improper handling may increase this effect. The self-discharge rate is typically doubled with every 10°C increase. A Li-ion battery has a self-discharge of 1~2% per month, Nickel-based has 10~15% per month.
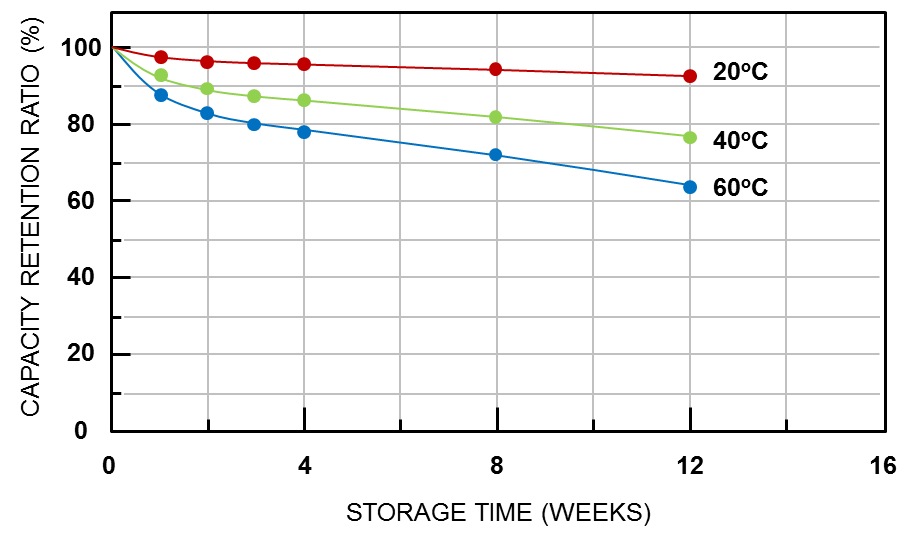
Figure 4. Capacity retention at different temperatures
2. Fuel Gauge Introduction
2.1 Fuel Gauge Functional Introduction
Battery management is part of power measurement. The fuel gauge is responsible to estimate the capacity of battery in the domain of battery management. The basic function of fuel gauge is to monitor the voltage, charge/discharge current and battery temperature, and to estimate the battery’s SOC and Full Charge Capacity (FCC) of battery. There are two classic methods to do the SOC estimation which are Open Circuit Voltage (OCV) and Coulomb Counter, respectively. The other method is dynamic voltage-based algorithm designed by RICHTEK.
2.2 Open Circuit Voltage
The open circuit voltage algorithm of fuel gauge is easy to implement by mapping open circuit voltage to the SOC look-up table, and using several points to fit the OCV curve. The general definition of open circuit voltage is only if battery relaxed for approximately more than 30 minutes.
The battery voltage curve varies according to different loads, temperatures, ages, etc, so a static OCV table can’t represent the SOC. The SOC estimation cannot rely on the look up table. As a result, SOC error is big if it is only estimated by OCV.
The following figure shows that the SOC error is huge when battery is under charge and discharge conditions, because the I-R drop is caused by battery’s impedance and charge/discharge current. It means SOC estimation by static voltage measurement should be done with separated charge and discharge look-up table.
Figure 5. The battery voltage under charge and discharge conditions
The figure below shows that the SOC variation is still big in the discharge condition under different loads. So the OCV is only suited for lower SOC accuracy request systems like a vehicle’s lead acid battery or uninterruptible power supply.
Figure 6. The battery voltage under different loads in the discharge
2.3 Coulomb Counter
The coulomb counter operation theory is to connect a sense resistor in the charge/discharge path of battery. The ADC measures the voltage on the sense resistor and then transfers the current value when battery is under charge or discharge. A real time counter (RTC) provides the timing base for integrating the current to coulomb information.
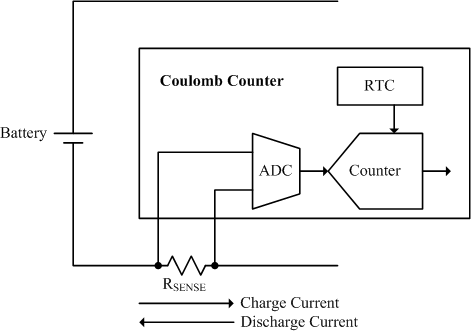
Figure 7. Coulomb counter basic operation diagram
The coulomb counter provides accurate short-term accuracy of SOC reporting during charge or discharge. It can report the information of remaining capacity (RM) and full charge capacity (FCC) by charge coulomb counter (CCR) and discharge coulomb counter (DCR), and report SOC by RM and FCC (SOC – RM / FCC). Besides, it can provide the remaining time estimation like time to empty (TTE) and time to full (TTF).
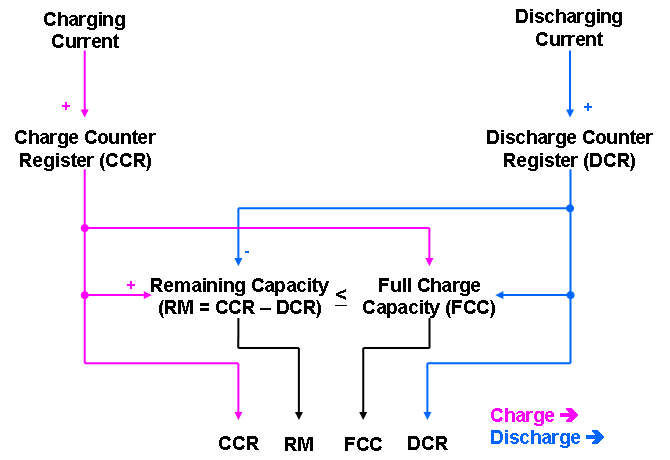
Figure 8. Coulomb counter calculation formula
There are two key factors which cause coulomb counter accuracy drift. The first is the accumulation of offset error in the current sense and ADC measurement. Although the measurement error is small for present techniques, the error increases over time in such systems if there is no good method to eliminate it. The figure below shows that the accumulation error is boundless if the correction condition is not observed over time in the actual application.
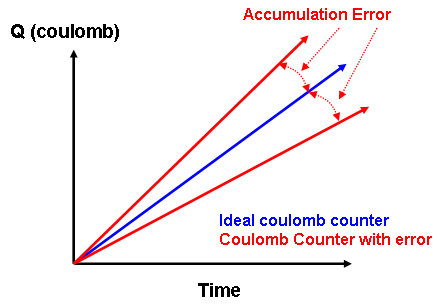
Figure 9. Coulomb counter accumulation error
To eliminate the accumulation error, there are three events that can be used in the normal battery operation. They are End of Charge (EOC), End of Discharge (EOD) and relax. If the EOC condition is reached, it means the battery is fully charged and SOC should be 100%. The EOC event is usually defined by charge and the condition of that also influences the performance of coulomb counter. The EOD condition means the battery is empty under discharge and then the SOC should be 0%. It can be an absolute voltage level or a variable which is compensated by loading. The relax condition is reached when battery has no charge or discharge and remains that way for a long time. The OCV table is necessary if users want to use relax condition for coulomb counter error correction. The following figure shows that the SOC error is fixed when above conditions are met.
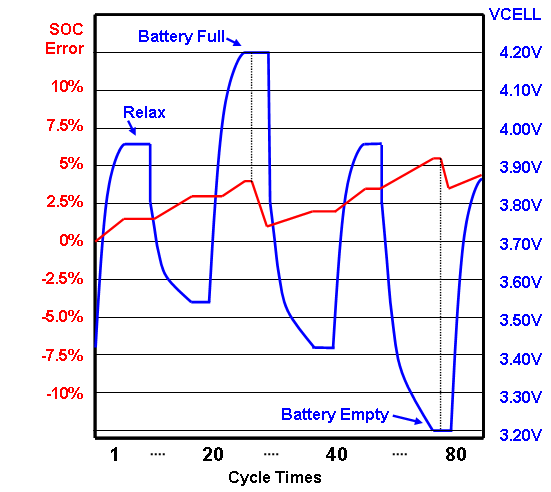
Figure 10. The condition for eliminating coulomb counter accumulation error
The second factor to cause coulomb counter error is the FCC error, which is the deviation between the algorithm account and real FCC of battery. The FCC will be influenced by temperature, aging, loading, etc. So, FCC re-learning and compensation methods are also key points for coulomb counter algorithm. The following diagram shows the trend of SOC error when FCC is overestimated and underestimated.
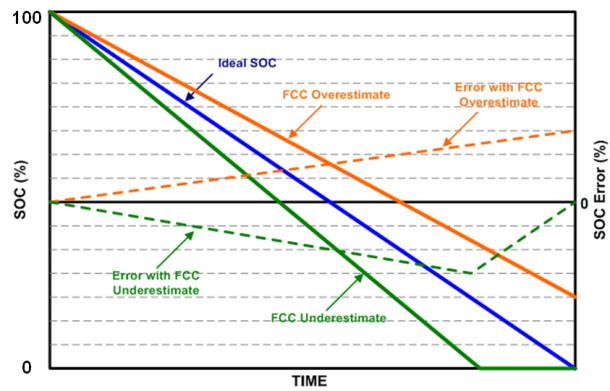
Figure 11. FCC error when overestimated and underestimated
2.4 Dynamic Voltage-based Fuel Gauge
The dynamic voltage-based fuel gauge calculates and determines the Li+ battery SOC according to battery voltage only. The algorithm estimates the increasing or decreasing SOC by an iteration model according to the difference between the battery voltage and the battery OCV. The dynamic voltaic information can effectively emulate the Li+ battery behavior and determine the SOC(%), but can’t estimate battery capacity(mAh).
The calculation is based on the battery voltage information and the dynamic difference between battery voltage and relaxed OCV, by using an iteration algorithm to calculate the increasing or decreasing SOC to estimate SOC. Compared to coulomb counter-based fuel gauge solution, voltage-based fuel gauge does not accumulate error with time and current. The coulomb counter based fuel gauge suffers from SOC drift due to current-sense error and cell self-discharge. Even if there is a very small current sensing error, the coulomb counter accumulates the error continuously. The accumulated error can be eliminated only by fully charging or fully discharging.
The voltage-based fuel gauge estimates battery SOC only by voltage information and will not accumulate error because it does not rely on battery current information. To improve the SOC accuracy, the optimized gain in dynamic voltage-based algorithm can be adjusted according to the actual voltage curve of the specific phone under full-charging and full-discharging.

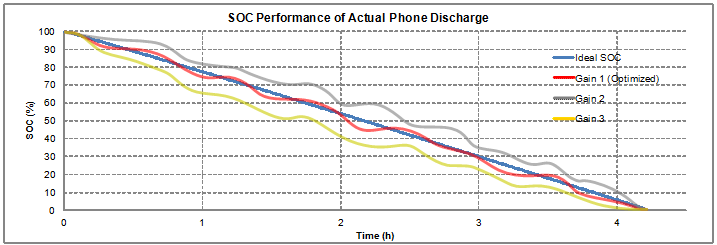
Figure 12. Dynamic voltage-based fuel gauge and the gain optimization
The following is the SOC performance of dynamic voltage-based algorithm at the different C-Rate conditions, and it shows that the SOC accuracy is good. The overall SOC error is smaller than 3% in the C/2, C/4, C/7 and C/10.
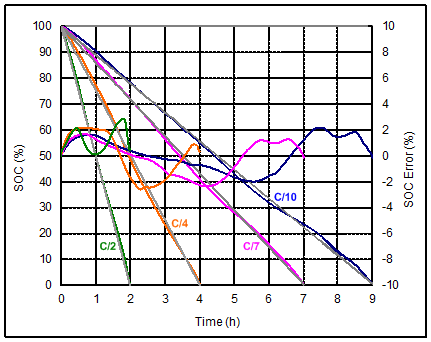
Figure 13. Dynamic voltage-based SOC performance at different C-Rate conditions
The diagram below is the SOC performance under partial charge and discharge conditions, and it shows that the SOC error is still small and the maximum error is only about 3%.

Figure 14. Dynamic voltage-based SOC performance in the partial charge and discharge conditions
It does not accumulate error with time and current. That is an advantage compared to coulomb counter which suffers from SOC drift caused by current-sense error and battery self-discharge. The dynamic voltage-based algorithm has poor short-term accuracy and slower response time because there is no charge/discharge current information. Besides, it can’t estimate the full charge capacity, either. It has accurate long-term accuracy because battery voltage will indicate the SOC, eventually.
3. RT9428 Fuel Gauge and Testing
3.1 RT9428 introduction
The RT9428 is a compact, host-side fuel gauge IC for lithium-ion (Li+) battery-powered systems. For the embedded Fuel Gauge function, the state-of-charge (SOC) calculation is based on the battery voltage and the dynamic difference between battery voltage and relaxed OCV to estimate the increasing or decreasing SOC.
RT9428 and RT9420 have the same functions but have the different package type. The RT9428 is in the WL-CSP-8B 1.6x1.52 (BSC) package and the RT9420 is in the WDFN-8L 2x3 package.
Figure 15. The package and pin definitions of RT9420 and RT9428
The RT9428 is used on system side and directly powered from the battery. Refer to below typical application circuit, the RC filter saves the noise for IC power supply and voltage measurement on VBAT pin. To reduce the I-R drop effect, make the connection of VBAT as close as possible to the battery pack. The ALERT pin provides a battery low interrupt signal to system processor when capacity low is detected. The QS pin is unused in typical configuration, it needs to be tied to GND.
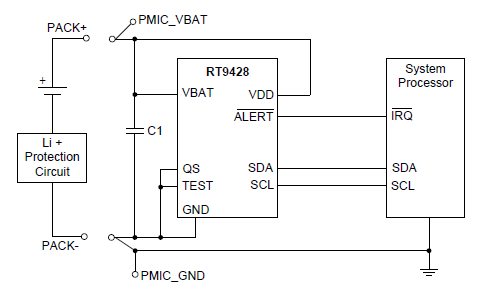
Figure 16. RT9428 typical application circuit
RT9428 using voltage-based algorithm can support smoothly SOC and does not accumulate error with time and current. That is an advantage compared to coulomb counter which suffer from SOC drift caused by current-sense error and battery self-discharge. Below is the comparison between voltage-based algorithm and coulomb counter.
|
Solution
|
Advantage
|
Disadvantage
|
|
OCV Lookup Table
|
• Voltage measurement, no current sensing
• Easy implement by look-up table
|
• Incorrect SOC when dynamic loading
|
|
Coulomb Counter
|
• Report remaining capacity (mAh)
• Report SOC(%)
• Compensate dynamic load effect
• Accurate SOC for single discharge
|
• Need full charge and discharge learning cycle
• Need current sense resistor
• Accumulate error by coulomb counter error and self-discharge
|
|
Voltage-Based Dynamic Model
|
• Eliminate learning cycle
• Report SOC (%) by voltage-based dynamic model without current sensing
• No accumulate error
|
• Slow response time for dynamic load
• Cannot report remaining capacity(mAh) due to no information of current and full capacity
|
3.2 RT9428 Temperature Compensation
According to chapter 1.1, the battery characteristics will be different at different temperatures. Before doing the fuel gauge temperature compensation in software driver, we should pre-determine the battery parameters at different temperatures, usually 5/25/45°C. Then, software driver check the system temperature periodically, write the parameters (VGCOMP) into RT9428 according to temperature. Please refer to below pseudo code and block diagram.
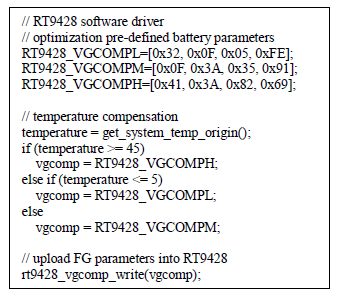
Figure 17. RT9428 software driver pseudo code
3.3 Testing Condition
Definition
Ideal SOC: actually SOC is according to charge/discharge capacity and full-capacity after testing is finished. The ideal SOC can only be re-calculated after testing finishes, because the real discharge-capacity is calculated after discharging is finished.
SOC: SOC report of fuel gauge
FCC: Full charge capacity calculation from integration of the current and time after testing is finished
SOC Error: Difference between report SOC and ideal SOC
Use RT9420/9428 EVB to test fuel gauge performance with below test conditions:
- Constant Current Discharge / Charge Test
- Constant Power Discharge Test
- Real Mobile Phone Test
Testing Block Diagram
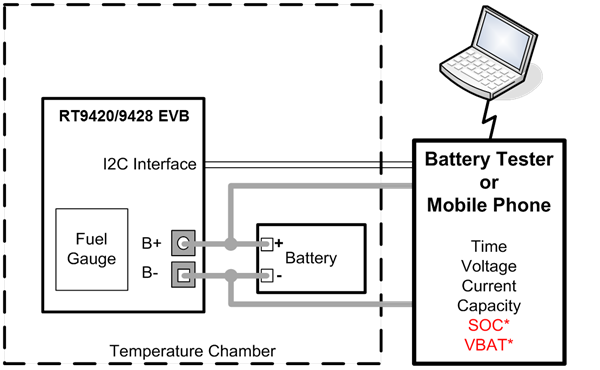
Figure 18. SOC and VBAT access from Fuel Gauge by I2C interface
3.4 Example of Constant Current Discharge Testing
Testing to confirm fuel gauge can provide accurate SOC report at different loads and temperature conditions.
Condition: C/4 & C/7 discharging, until voltage < 3.3V at 5/25/45°C
Figure 19. Testing result of constant current discharge
3.5 Example of Constant Power Discharge Testing
Testing to confirm fuel gauge can provide accurate SOC report at different load conditions.
Condition: Constant 3W, 4W and 5W discharging, until voltage < 3.2V
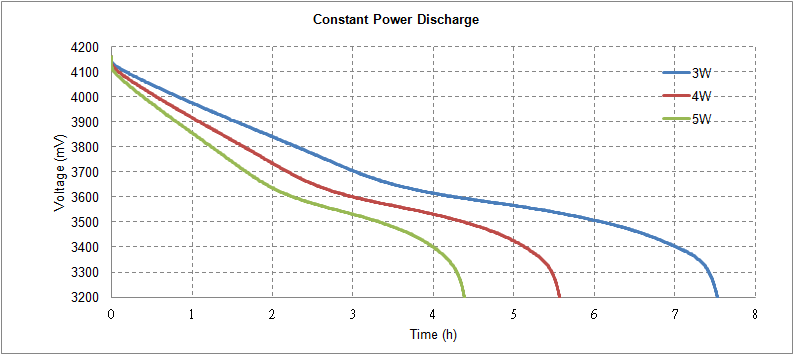

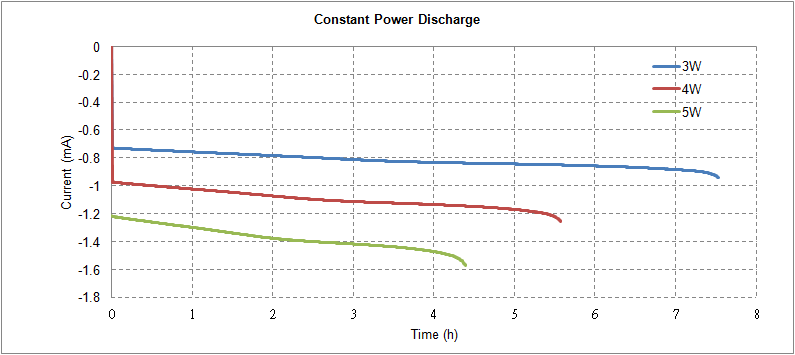
Figure 20. Testing result of constant power discharge
3.6 Example of Real Mobile Phone Testing
Testing to confirm fuel gauge can provide accurate SOC report with real mobile phone system.
Conditions:
Dynamic and normal discharge, until mobile phone turns off automatically.
Normal charge, until mobile phone stops charging automatically.
Figure 21. Testing result on mobile phone