Simulation & analyze
 Start
analyze
Start
analyze
 View analysis result
Starting analysis
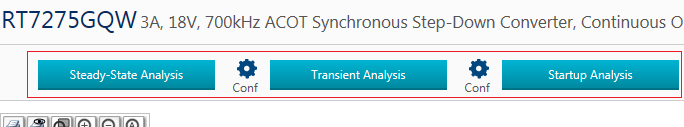
The simulator provides three kinds of analysis: Steady-State Analysis, Transient Analysis, and Startup Analysis. Click the buttons to start analysis
Verifying simulation results
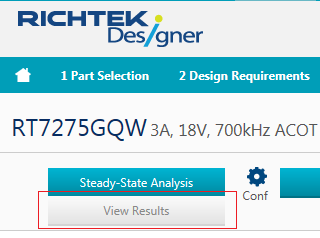
After analysis complete, You'll see a "View Results" button next to the analysis button. By clicking it, various simulation waveforms can be selected to view in WebScope window. Click a snapshot to open it in WebScope.
 Waveform in WebScope
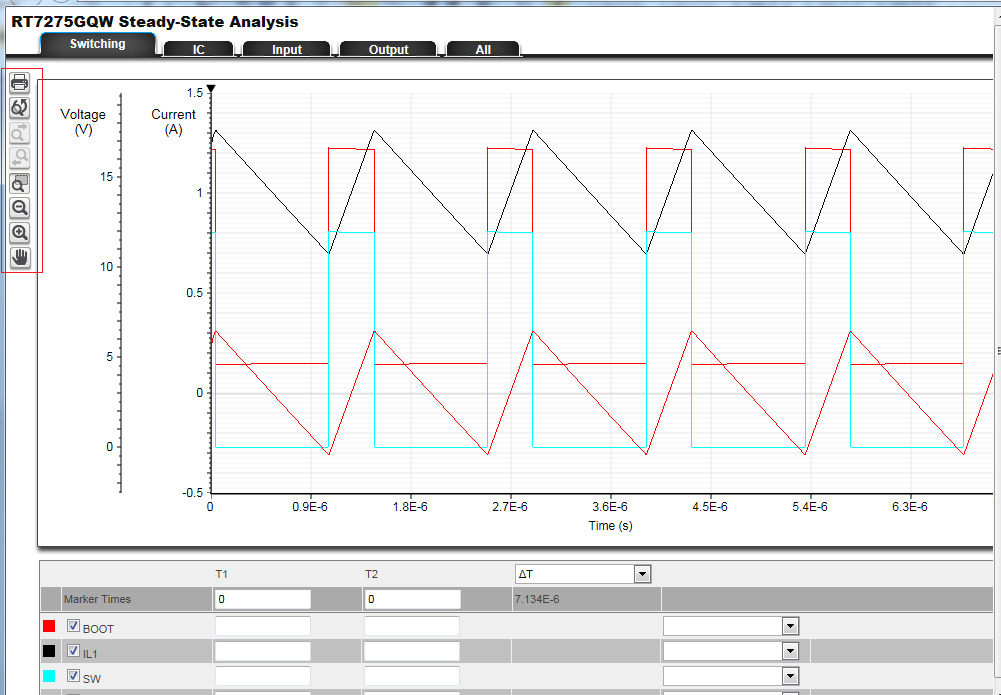
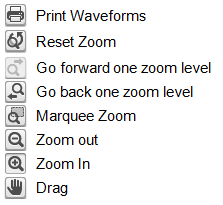
In the left of WebScope, you can click these icons to perform zooming or other function to help verify your simulation results.
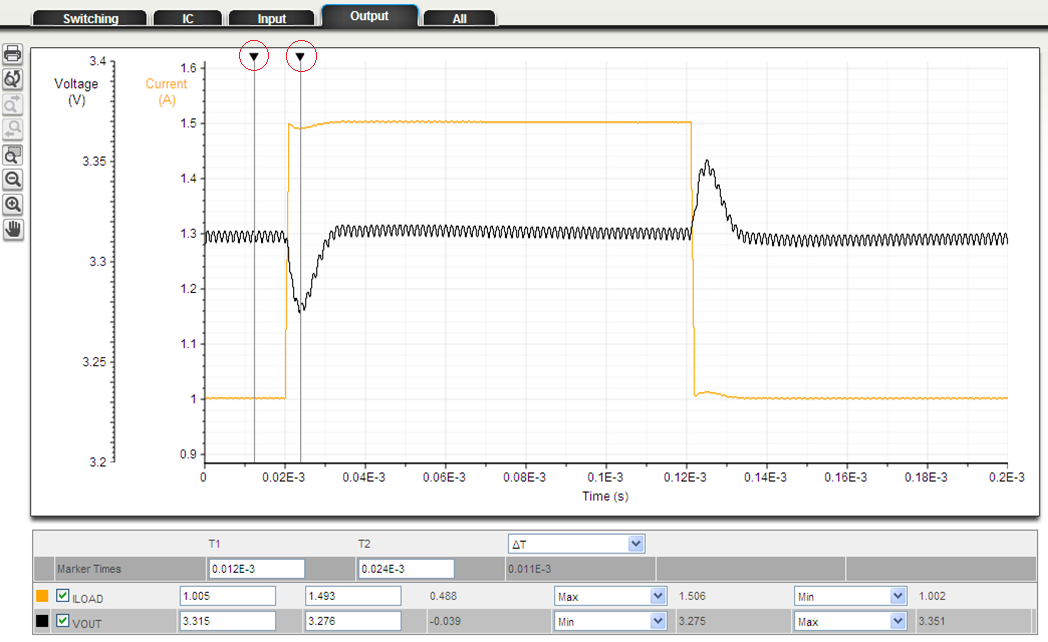 Using markers
Using markers
The marker T1 and T2 on the horizontal axis are in the graph upper part. With sliding the marker, the time between 2 points can be measured. Also, it is possible to change when clicking the unit of the horizontal axis.
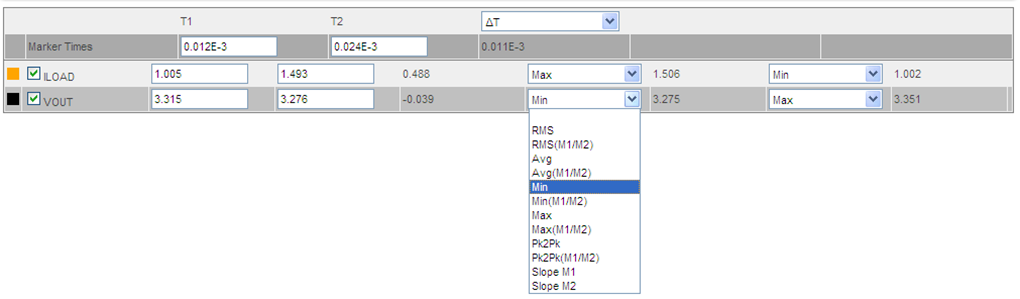 Switching waveform measurements
Switching waveform measurements
Different waveform measurements are available via the pull-down menu. For each waveform, two measurements can be selected.
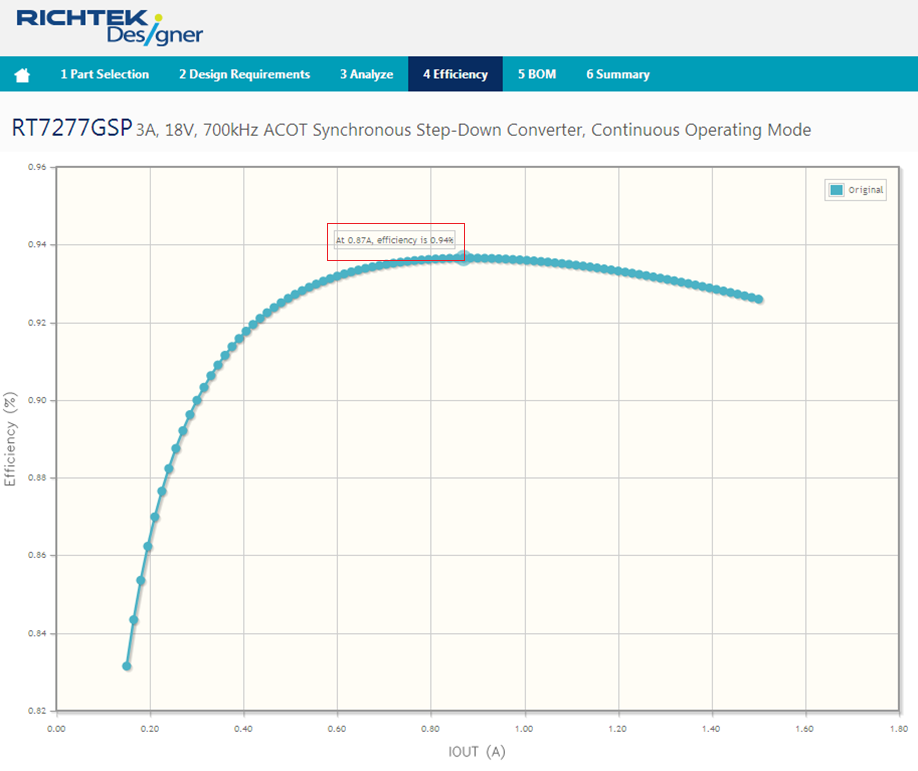 Viewing efficiency
Viewing efficiency
Click “Efficiency” for the efficiency waveform. By moving the cursor over the waveform, the exact efficiency values are displayed.